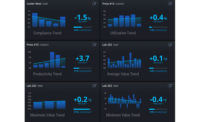
User-defined dashboard simplifies data analytics

Swift Sensors, Inc., Austin, Texas, added user-defined dashboards to simplify and enhance viewing and analytics of critical sensor data. These new features will help customers gain deeper insight into “big data” from wireless sensor networks and simplify IoT systems to deliver true value.
The Swift Sensors cloud-based dashboard allows real-time asset monitoring and sophisticated analytics from anywhere. The enhanced dashboard shows sensor data in the manner that’s most relevant to the business, including the option to create multiple views of data streams to identify patterns and correlations.
More details features include:
Custom Dashboards. Users can now create custom dashboards shared with all account users. Custom dashboards are user-defined pages with a collection of panels with only the data users want to see, in the order they want to see it.
Set Default Dashboard. Users can select their favorite dashboard to be their default view. When a dashboard is marked as the default view, the user will be taken directly to this dashboard upon signing into Swift Sensors.
Combo Chart. The dashboard now supports a new combo chart panel. This panel allows up to four measurements to be rendered on the same chart, even if those measurements use different units.
Expanded Language Support. Support for six new languages includes Danish, German, Spanish, French, Italian and Portuguese.
Full Screen App behavior on mobile devices. The dashboard behaves like a full-screen app on mobile devices, thanks to full-screen support when launched from a home screen icon on iOS and Android.
Incomplete Threshold and Notification Warning. Threshold and notification lists now show a yellow warning icon next to incomplete thresholds and notifications with missing assignments of users, measurements, bridges and/or sensors.
Swift Sensors, Inc.
866-308-1340
www.swiftsensors.com
Looking for a reprint of this article?
From high-res PDFs to custom plaques, order your copy today!


