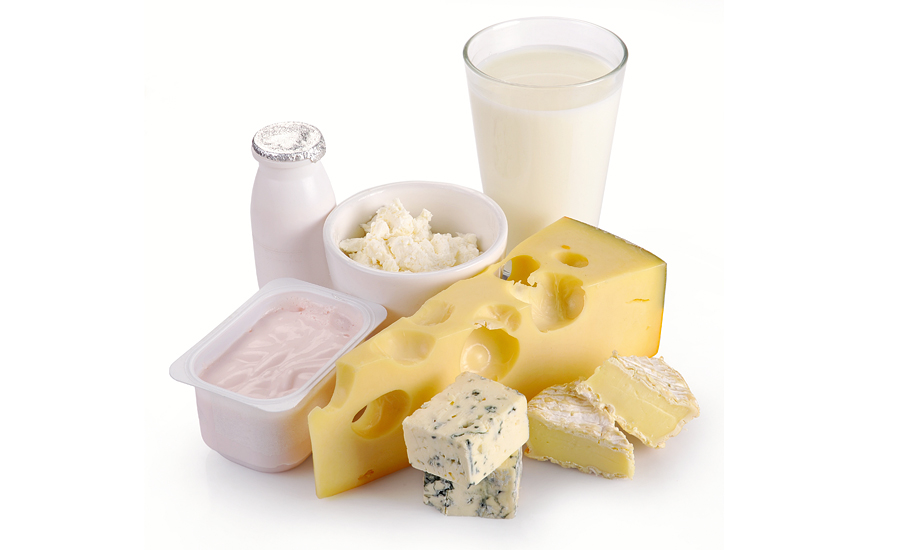
Domestically, Americans are eating more cheese, yogurt and butter, which more than offsets declines in fluid milk consumption, according to a report published by Rabobank, The Netherlands. The rest of the world is also demanding more U.S. dairy products. Over the past 10 years, U.S. milk production has increased by 13%, accommodating domestic and international demand growth, which has resulted from rising incomes and the expansion of quick-service restaurants. Lower milk prices have also encouraged cheese manufacturers to increase production, leading to high stock levels.
According to USDA data, Americans drank 149 pounds of milk per capita in 2017, down from 247 pounds in 1975. Over the same period, per capita consumption of cheese grew from 14.3 pounds to 36.9 pounds. The 22.6-pound increase in per capita cheese consumption over this period equates to 226 pounds of milk because it takes about 10 pounds of milk to produce a pound of cheese. As a result, the 98-pound annual decrease in fluid milk consumption has been more than offset by the 226-pound increase in milk used to manufacture cheese.
The cheese category has grown over several decades as demand for natural cheeses like American (which includes cheddar, colby and jack cheeses) and Italian-style cheese (dominated by mozzarella) has grown – from an annual average consumption of 11.7 pounds and 10 pounds per capita, respectively, in 1995 to more than 15 pounds each in 2017. Of the nearly 7 pounds of per capita cheese consumption not associated with the American or Italian categories, cream cheese is the next largest category, with 2.6 pounds of annual consumption, followed by Swiss cheese, with 1.1 pounds, and Hispanic cheese, with 0.8 pounds per person.
Despite recent claims that the processed cheese category is in decline, USDA per capita consumption data suggests that Americans continue to consume American singles and Velveeta. In 1995, the average American consumed 5.44 pounds of processed cheese. In 2017, the volume was 5.16 pounds. However, per capita consumption of processed cheese trended lower from 1995 through 2010, when it bottomed out at 3.53 pounds per person. Since then, per capita consumption of processed cheese has moved higher, reaching 5.16 pounds in 2017, which is the highest level since 1996.
Data from Information Resources Incorporated (IRI), Chicago, indicates that retail sales of processed cheese declined 3.9%, to 706 million pounds in 2017, from 735 million pounds in 2016. That trend continued into 2018, with sales estimated at 680 million pounds, down 3.8% vs. 2017. This means that processed cheese demand in the foodservice and food ingredient sectors have offset the retail slump. Think of the cheese on sandwiches, hamburgers, chicken sandwiches, veggie burgers, wraps, pitas, breakfast sandwiches and pizzas, as well as frozen variations of all of the above.
Rising incomes and the expansion of quick-service restaurants have grown global demand for milk and dairy products. Since 2000, U.S. dairy product exports have propelled from less than 3% of total milk production to more than 15% in 2017. International markets claimed 57% of U.S. non-fat dry milk, 46% of the country’s dry whey, 6% of its cheese, and 3.3% of its butter in 2017. Through October 2018, U.S. cheese exports totaled 294,170 metric tons, up nearly 3% from the previous year.
Despite rising domestic demand and increased exports, U.S. stocks of cheese as of Nov. 30, 2018 topped 1.35 billion pounds, up 7% (or 94 million pounds) from the previous year. Higher stock levels are understandable, given that 2018 U.S. cheese production neared 13 billion pounds, up 2.5% or about 316.5 million pounds. Increased production has contributed to more cheese in the supply chain – from the manufacturing facility where it is produced and often held for two weeks to clear quality to cut-and-wrap or shredding facilities to distribution centers, and ultimately on the retail shelf or in a foodservice outlet as an ingredient.
Lower milk prices in 2018 – the lowest price since 2010 – also contributed to the bump in cheese stocks. Manufacturers of aging cheeses, such as aged cheddar, took advantage of the opportunity to put cheese that will be cured for several months, or even several years, in storage.
Higher stocks and lower-than-expected cheese exports to Mexico have contributed to weaker domestic cheese prices, particularly in the second half of 2018 and into 2019. As a result, the average consumer price index for cheese slipped 1% in the last six months of 2018, vs. the first six months of 2018 – and it is expected to be lower than the prior year during the first quarter of 2019.


